👤 This article is for the main point of contact for a participating organization, whose course is hosted on reconciliationeducation.docebosaas.com
For courses hosted on learn.reconciliationeducation.ca and associated sites, click here.
What is a Power User?
Power Users are users who have permissions over and above regular learners, and can peer into the data side of the platform.
To learn more about what a Power User is, if your license includes one, and how to choose your Power User, click here to read our guide here.
Quick Navigation
- What features does a Power User have access to?
- How do I access Reporting features?
- Report Types
- How to: User Personal Summary Report
- How to: Course Summary Report
- How to: Course Dashboard Report
- How to: Branches Dashboard Report
- How to: Custom Reports Builder
What features does a Power User have access to?
Here's a quick technical summary of the features granted to Power Users inside Reconciliation Education's LMS (learning management system).
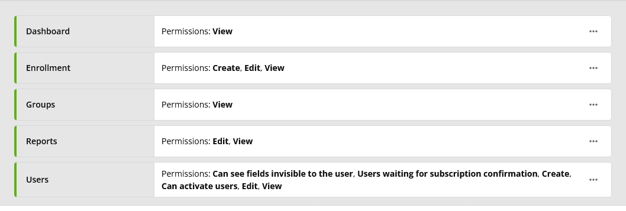
Dashboard: You have access to the Your Client Dashboard page, which contains some extra features not available on the standard learner Dashboard. This means that you can also learn alongside your group, without having to create a second account or change page views. You can access your learning any time from Your Client Dashboard, which features other helpful goodies and access to the Bonus Library.
Enrollment: For the first time, Reconciliation Education clients have the ability to register their own learners.
We only recommend using this feature if you and your team are experienced and proficient with LMS (learning management system), HR (human resources), or CRM (customer relationship management) softwares, as this process is highly technical, and errors lead to frustrated learners.
Please contact your Reconciliation Education team member to book a training call before proceeding with using this feature.
Groups: You can check in your assigned groups at any time. This means you can tell at a glance who is registered for your course(s), when they were registered, and check your overall used seats. This feature allows us to assign you just your learners to check in on.
Reports: Our reporting features are more robust than ever. With your Power User features, you have access to new kinds of reports, including graphic summaries that are presentation ready. Read below to learn how to access and use these features.
Users: Power Users have the ability to see all fields for a given user in their group, which can help you identify a user and how they fit into your organization. You can also assist users who may have incorrectly spelled their names, registered with incorrect emails, or have questions about their accounts or course progress.
How do I access Reporting features?
These are the most important part of the client experience: being able to check on your learners and their progress.
To start, log in to the course and access Your Client Dashboard.
This should be your home page when you log in, and should look similar to the below:
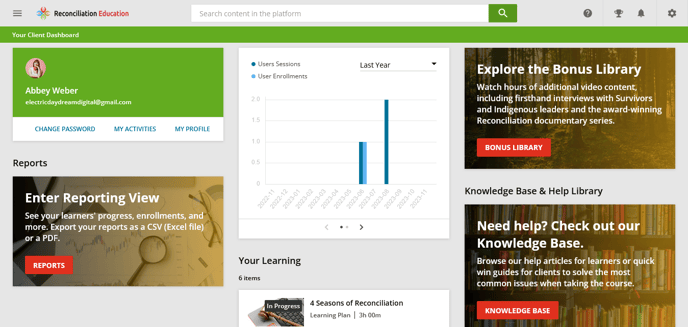
Click the "Reports" button on the "Enter Reporting View" card on the left hand side.
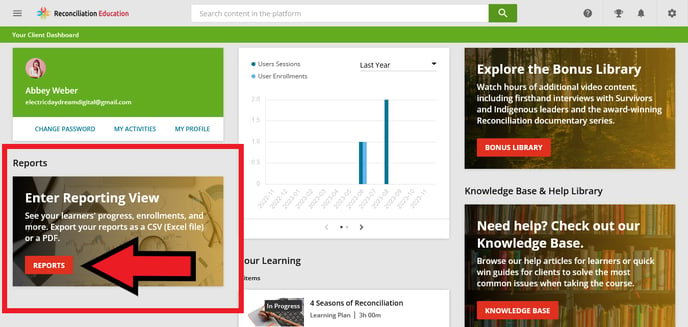
If you are not seeing a "Reports" button on your Dashboard, contact your Reconciliation Education team member, as your Power User account may not be fully set up or activated.
From the Reports page, you have several options:
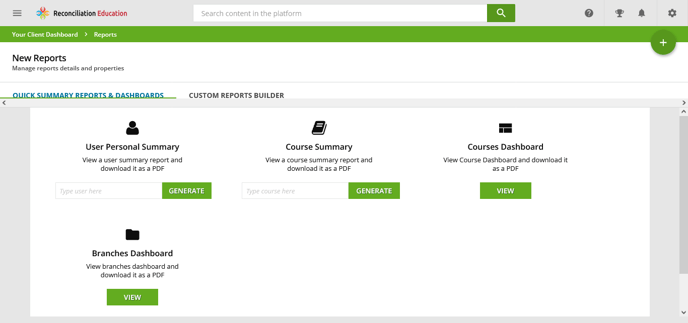
Report Types
From the list below, click on the type of Report you want to draw to be directed to the instructions for that type of Report.
1. User Personal Summary
User Personal Summary
From the Reports page, enter the username (email address) or name of your learner into the search bar below "User Personal Summary".
You will need to know the registered email address and/or name of the learner you are querying. If you are unsure of these details, consult the original list of learners you submitted or your Receipt Report.
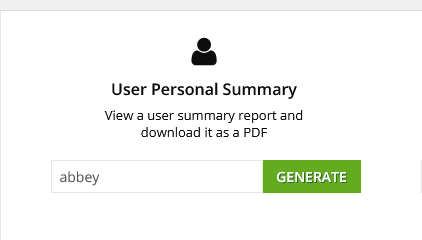
When their name appears in the dropdown box, click it.
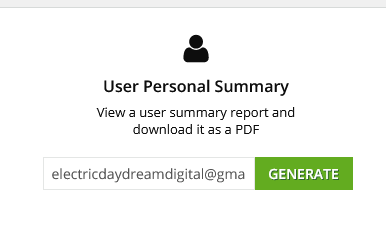
Once the learner has appeared in the search box, click Generate.
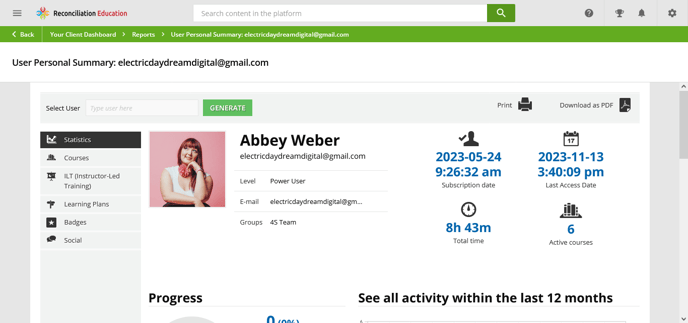
From this summary, you can:
- See an overview of the learner's account details, history, and overall progress from the Statistics tab (the main page that opens when you generate a report)
- See the learner's registered courses in the Courses tab
- See the learner's registered learning plans in the Learning Plans tab
- See any badges the learner may have earned in the Badges tab
- Print or download the user summary report by using the Print and Download as PDF buttons in the top right corner.
For more support with User Personal Summary Reports, visit this guide from our LMS Partner, Docebo.
Please note: Reconciliation Education does not use the Discover, Coach & Share module; please ignore the content in this guide which refers to those features.
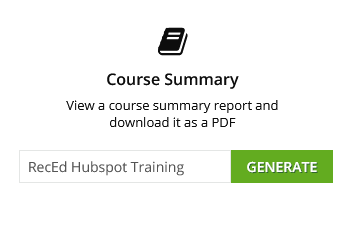
Course Summary Report
Start from the Reports page. Below the "Course Summary Report", enter the name of your course.
Most courses will be called 4 Seasons of Reconciliation. You may have additional course products with other names.
If you are unsure of what course products you need to generate a report for, we suggest checking your own User Personal Summary to see what you are registered for, and copying those course names (one at a time) into this search.
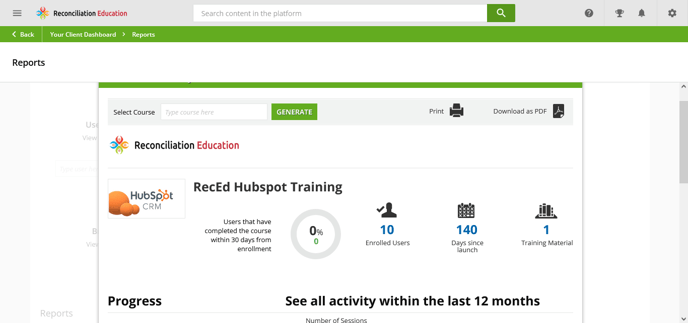
In this example, we will be generating a Report for a course called RecEd HubSpot Training.
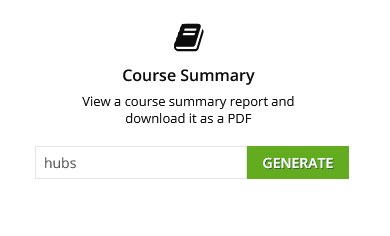
When the course name appears in the dropdown box, click it.
Once the course name has appeared, click Generate.
A popup window will open with a summary of this course. It should look similar to the below:
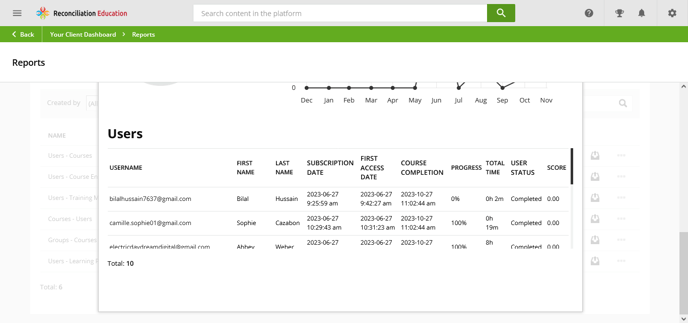
You can scroll down on the right hand side of this popup to also see the Users information:
From this summary, you can:
- See the total number of learners registered for the course in the top banner
- See the number of days since your course launched in the top banner (please note that for express and generic pathway clients, this date may be inaccurate to your actual launch)
- See the number of learner logins broken down by month in All Activity Within the Last 12 Months
- See user completion, time to complete, progress status, and more in the Users section
- Print or download the course summary report by using the Print and Download as PDF buttons in the top right corner.
For more support with Course Summary Reports, visit this guide from our LMS Partner, Docebo.
Course Dashboard Report
Start from the Reports page. Click on the View button below Course Dashboard.
This will open a new page automatically, which will be similar to the below. This Dashboard Report will show all courses you are assigned to as a Power User.
In this example, we will be generating a Report for a course called RecEd HubSpot Training.
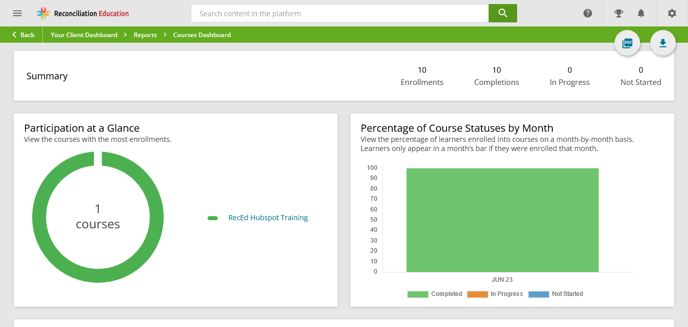
The top part of this page shows 2 types of graphical summaries:
- A circular Participation at a Glance graphic that shows the breakdown of available courses and how many learners are registered for each. This graphic will show "1 courses" unless you have a French edition of the course or an additional Reconciliation Education course product.
- A bar graph of Percentage of Courses Statuses by Month. This bar graph shows you how many learners have completed, begun, or not started the course proportionally by month. This graphic is great for assessing overall completion rates and speed for your organization.
You can download this Report view (before proceeding to the Users breakdown in the next step) by clicking on the Export as XLSX or Download as PDF buttons in the top right corner.
The bottom of the page shows the courses assigned to you as a Power User.
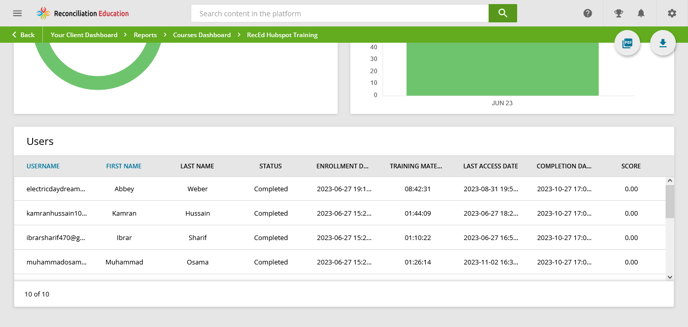
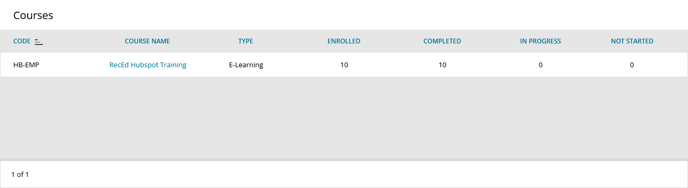 By clicking on a course name (blue text), you will open a second summary with the same 2 graphics as above, but showing detailed information by learner in a new Users section, which replaces the Courses section above.
 You can download this Report by clicking the Download as PDF or Export as XLSX buttons in the top right corner.
From this Report, you can:
- See the total number of learners registered for the course in the top banner
- See the total number of learners who have completed the course in the top banner
- See all course products assigned to you in the Courses section
- See the breakdown of learner completion rates broken down by month in Percentage of Course Statuses by Month
- See user completion, time to complete, progress status, and more in the Users section
- Print or download the course summary report by using the Print and Download as PDF buttons in the top right corner.
For more support with the Course Dashboard and Course Dashboard Reports, visit this guide from our LMS Partner, Docebo.
Branches Dashboard Report
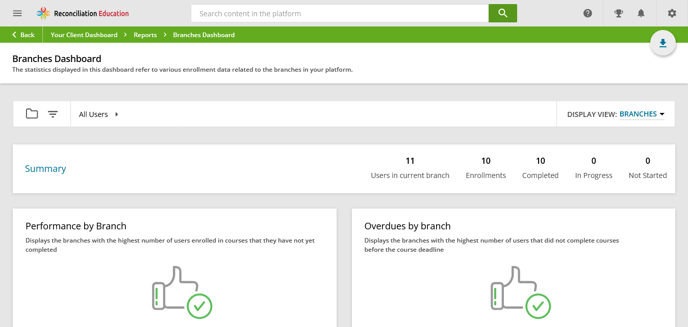
Start from the Reports page. Click on the View button below Branches Dashboard.
This will open a new page automatically, which will be similar to the below. This Dashboard Report will show only learners you are assigned to as a Power User.
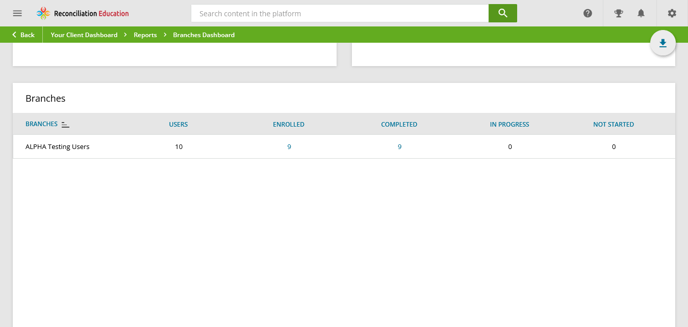
At the bottom of this Report, you can see Branches.
This space will show all Branches assigned to you as a Power User, and a short summary of this Branch.
You can download this Report view (before proceeding to the Users breakdown in the next step) by clicking on the Export as XLSX button in the top right corner. PDFs are not available for this Report type.
By clicking on Enrolled or Completed or In Progress or Not Started (blue text) Numbers, you will open a new summary showing detailed information by learner.
Clicking the Enrolled number (9 in the example above) will open a Report showing every enrolled learner and their progress in the courses or course products they are registered for, as well as additional information.
Here's an example:
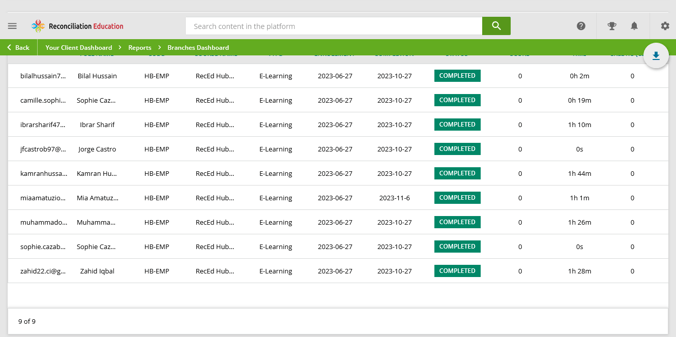
Clicking the Completed number (9 in the example above) will open a Report showing every learner who has completed a course assigned to them, as well as additional information.
Clicking the In Progress number (0 in the example above) will open a Report showing every learner who has not completed a course assigned to them, but has begun the course; as well as additional information.
Clicking the Not Started number (0 in the example above) will open a Report showing every learner who has not started a course assigned to them, as well as additional information. Please note that Not Started learners may have logged in to the course portal, but not begun their learning.
You can export any of the above views as a XLSX (Excel) document using the Download as XLSX button in the top right.
From this Report, you can:
- See the total number of learners registered for the course in the top banner
- See the total number of learners who have completed the course in the top banner
- See the total number of learners who have not begun the course in the top banner
- See the total number of learners who are in-progress in the course in the top banner
- See overdue courses in Overdues by Branch. Please note that most Power Users are only assigned to 1 branch, and data may not populate here (as it compares Branches assigned to you).
- See if you have a branch with high rates of non-completion in Performance by Branch. Please note that most Power Users are only assigned to 1 branch, and data may not populate here (as it compares Branches assigned to you).
- See your assigned Branches in the Branches section.
- See additional learner status information by using the Enrolled, Completed, In Progress, and Not Started sub-reports
- Print or download the course summary report by using the Print and Download as PDF buttons in the top right corner.
For more support with the Branches Dashboard and Branches Dashboard Reports, visit this guide from our LMS Partner, Docebo.
Custom Reports Builder
The above Report types may not satisfy every reporting need, so you may want to consider building your own Custom Report.
We recommend this if you are proficient in LMS, CRM, or HR software and are familiar with this type of program; and if you expect to be regularly drawing reports from the system.
Setting up a Custom Report can take up to 1 hour to fully build out, but the results are very worth it! Here are some of the benefits of setting up your own custom report.
- You can set the Report to only show data you care about - you can filter in what matters, and filter out the clutter to see only what your organization needs
- You aren't bound to the preset Reports listed in this article, and can combine data features from several types of Reports
- This Custom Report template is saved to your account so you can draw the same type of data at any time during your license and create a custom, streamlined flow of data specific to your organization
- You can even schedule custom reports to be sent to you directly on a set schedule, and reduce your admin load and input time to facilitate the course
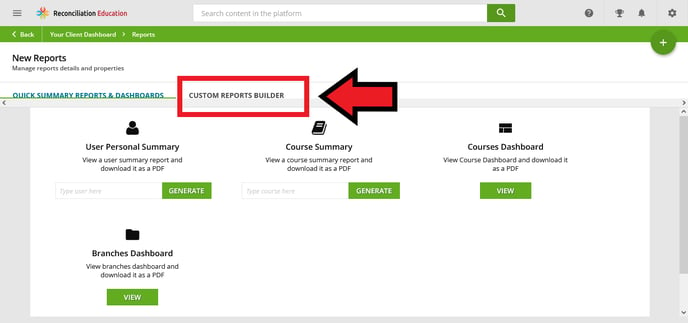
To access the Custom Reports Builder, open the Reports page and click on the Custom Reports Builder tab.
For in-depth instructions and a full guide to building your custom report, click here to read the instructions and troubleshooting guide from our LMS Partner, Docebo.